Add an interactive chart exported as an iframe
R libraries such as plotly-r can export the interactive chart as an HTML widget, which you can then embed as an iframe on the page.
The exported HTML page usually has one
.htmlfile as an entry point and several supporting assets it uses.Place the exported widget files in the
/template/charts/r-exports/folder. You can also create subfolder (e.g./template/charts/r-exports/name-of-chart/) for a standalone export that does not share libraries with other exports.Again, the container element with the class
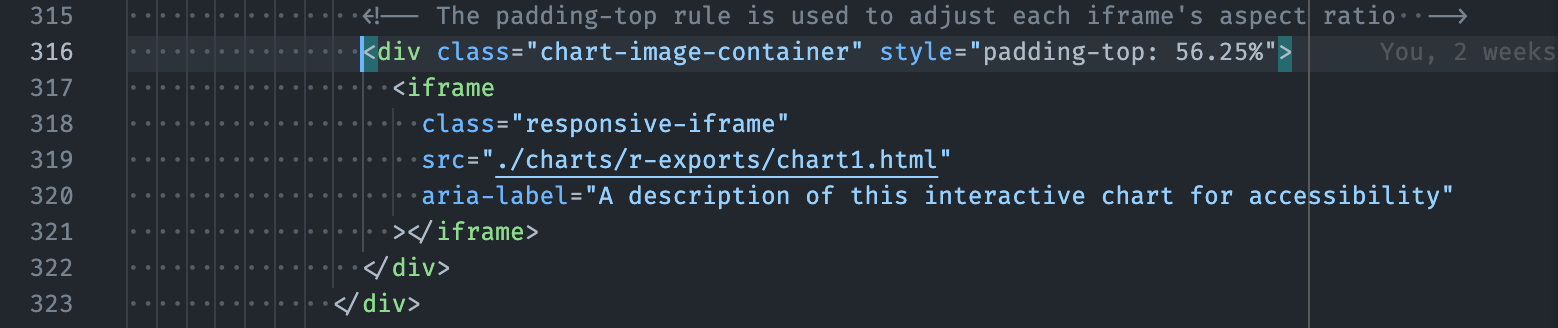
chart-image-containeris used for displaying these charts too. In the HTML file, find one of these elements which you want to place the chart in. You can use the editor's text search feature to search forclass="chart-image-container"and locate them.Add an
<iframe>tag and its associated attributes as the screenshot below to point to the entry.htmlfile you just placed in the folder.- The
<iframe>must have theresponsive-iframeCSS class to be responsive. - It also needs to have an
aria-labelso that the screen reader can read its content to a visually impaired user. - The
style="padding-top: 56.25%"special attribute controls the aspect ratio (width/height) of the iframe. You need to adjust this for each chart individually to make sure the chart is not being cut off. For example, a 16:9 aspect ratio is represented bystyle="padding-top: 56.25%"because 9(height) / 16(width) = 0.5625, which is 56.25%.
- The