Add or update the corresponding data table for each chart
The data table for each chart is created using Google Sheets. It provides out of the box iframe embed and download capabilities:
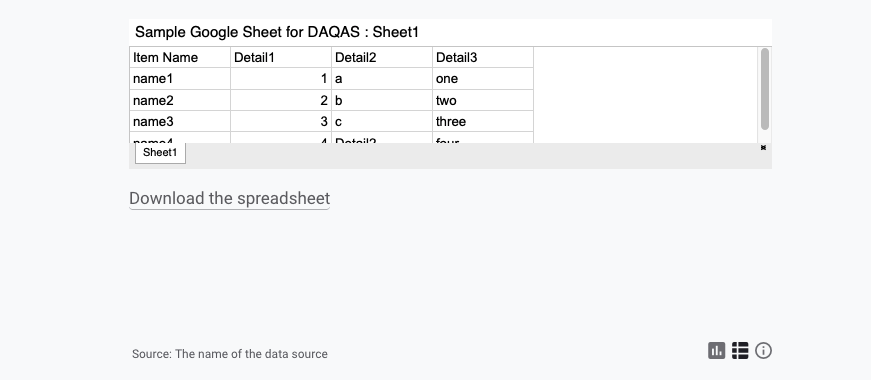
Create the table#
- Create or open a Google Sheet, insert your table(s). You can use one document with several sheets. Each sheet contains the data table for one chart.
- Click: File -> Publish to the web
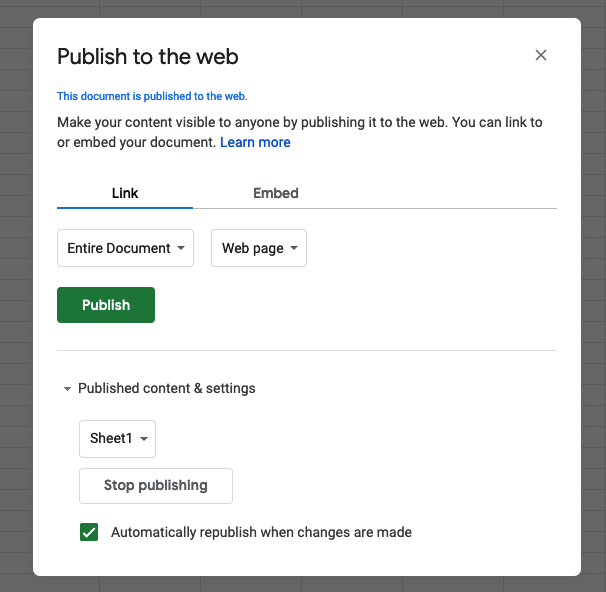
For download, under the "Link" tab:
- Select the sheet you want to publish for download, then choose the file type you prefer
- Click "Publish", copy the URL generated
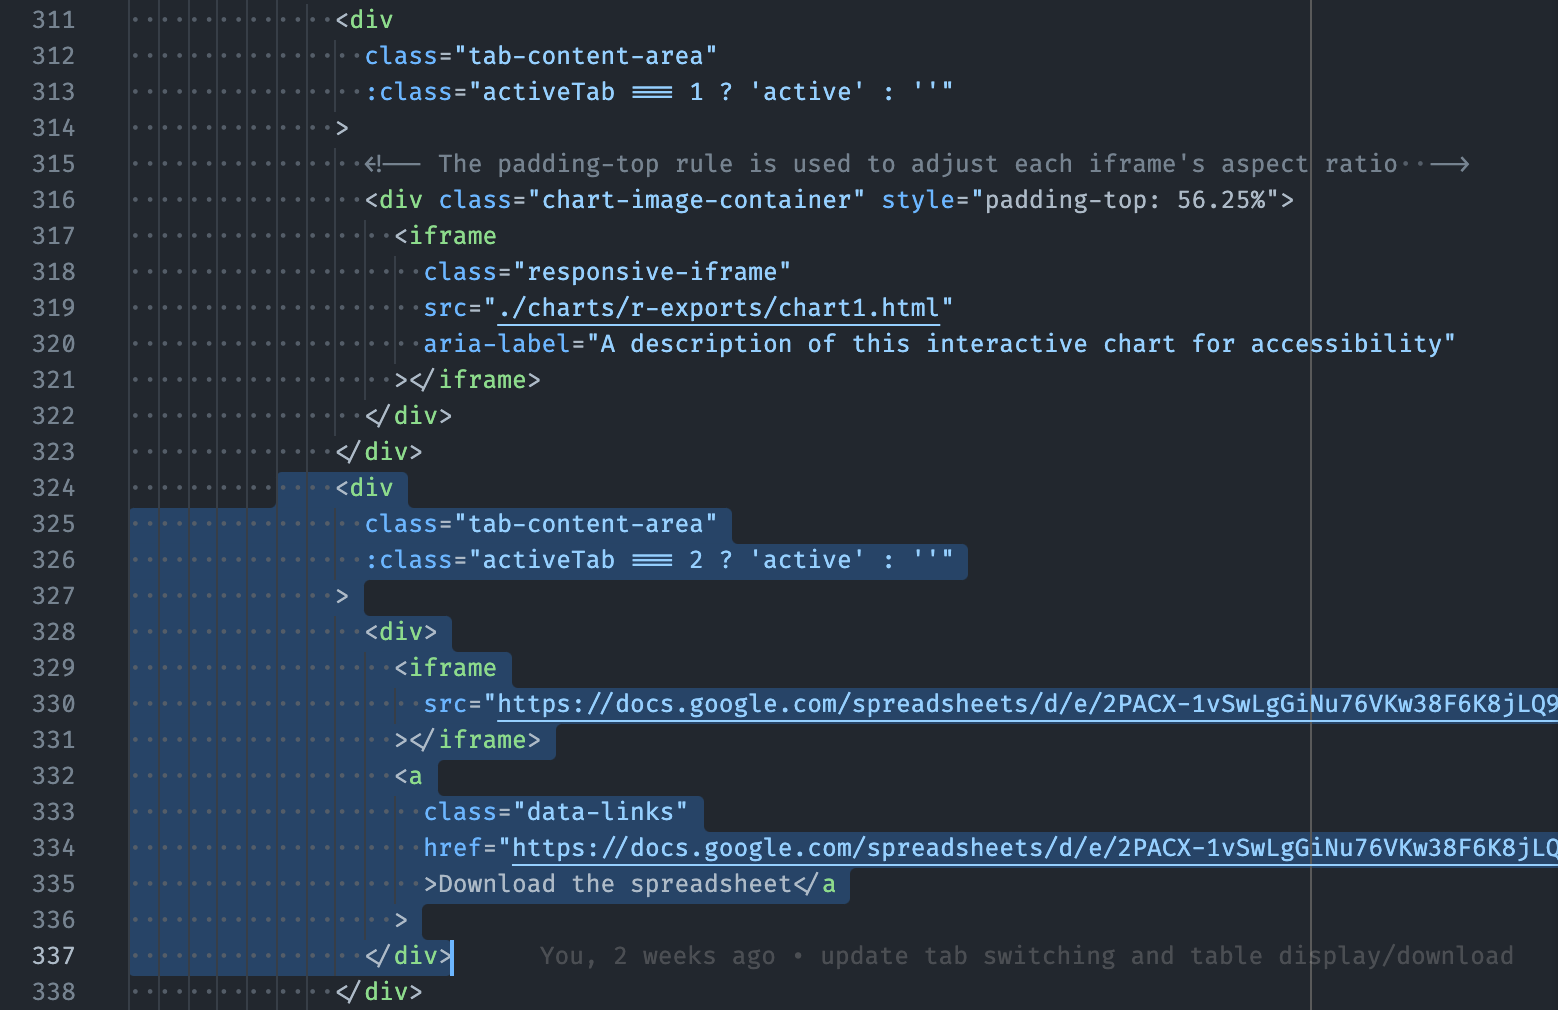
- (See screenshot below) Paste the URL in the
hrefattibute of the<a class="data-links">element (the element is inside the secondtab-content-areaelement). (The HTML element for all the data table has a special attribute of:class="activeTab === 2 ? 'active' : ''".)
For embed, under the "Embed" tab:
- Select the sheet you want to publish for embed
- Click "Publish", copy the
<iframe>code generated - (See screenshot below) Paste the
<iframe>code in the<div>of the table'stab-content-areaelement.
Update the tables#
When publishing, if "Automatically republish when changes are made" is enabled, the table in the web template will always has the latest content. Otherwise, you need to republish the sheet after you make a change.